
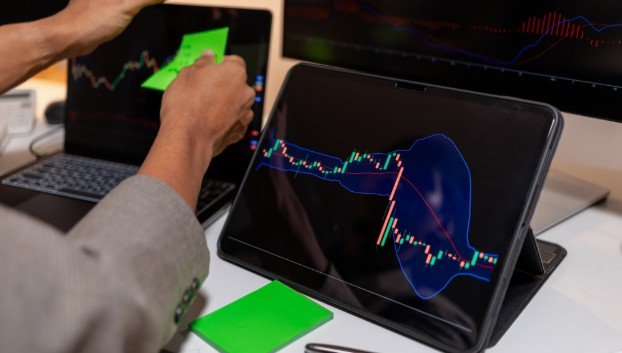
When I first began following technology stocks, I quickly discovered that seeing a price move was easy; understanding why it moved was much harder.
Nasdaq Fintechzoom offers a convenient starting point by combining market charts, company information, technical indicators, and financial news. However, investors must know how to interpret those resources, confirm when prices were updated, and separate meaningful market signals from ordinary short-term noise.
What Is Nasdaq Fintechzoom?
The term describes FintechZoom’s coverage of the Nasdaq market rather than a separate exchange, brokerage, or trading platform. FintechZoom is also not a division of Nasdaq. It is a financial-information website that publishes market data, commentary, company analysis, and educational material.
Nasdaq itself can mean several different things. It is an electronic stock exchange, but the name also appears in major market indexes. The Nasdaq Composite measures thousands of common stocks listed on the exchange, while the Nasdaq-100 follows 100 of its largest eligible nonfinancial companies.
Although both indexes have substantial technology exposure, neither consists exclusively of technology businesses. They also include companies operating in retail, healthcare, consumer services, communications, and biotechnology. Understanding this distinction prevents investors from using the two benchmarks interchangeably.
Is the Market Information Actually Real Time?
“Real time” does not always mean that every number changes instantly. Public index values may be displayed with a short delay, while licensed professional feeds can deliver faster trade and quote information. The delay can depend on the data provider, subscription level, market session, and type of security being viewed.
Before reacting to any movement, investors should check the timestamp, ticker symbol, exchange, and session status. A price displayed before the opening bell may represent premarket trading, while a number shown after the closing bell may include extended-hours activity.
This matters because trading volume is normally lower outside regular market hours. A dramatic premarket price change can weaken or reverse once regular trading begins and market participation increases.
How to Track Technology Stocks Effectively
Begin With the Wider Market
A practical tracking routine starts with the Nasdaq Composite or Nasdaq-100 rather than an individual company. The index direction reveals whether a stock is moving with the broader growth market or reacting to company-specific developments.
Investors should then compare the Nasdaq with other major indexes. If several benchmarks are rising, sentiment may be broadly positive. If the Nasdaq advances while the wider market falls, a limited number of influential technology companies may be driving the movement.
Build a Focused Technology Watchlist
Instead of following dozens of unrelated companies, investors can organize a watchlist by industry. Useful categories include semiconductor manufacturers, cloud-computing providers, software developers, cybersecurity companies, digital platforms, e-commerce businesses, and consumer-device producers.
Large companies such as Apple, Microsoft, Nvidia, Amazon, Alphabet, Meta, Broadcom, and Tesla often influence index performance because of their market values. Smaller businesses can produce larger percentage movements, but they may also carry greater volatility, weaker liquidity, and higher business risk.
Check Price and Volume Together
Price tells investors what changed, while volume indicates the level of market participation behind that change. A stock rising on unusually strong volume may attract more attention than one moving upward during quiet trading.
Relative volume, daily percentage change, previous closing price, session high, and session low add useful context. Market breadth is equally important. An index rally supported by many advancing companies can be stronger than one produced by only a few mega-cap stocks.
Review News and Earnings
Technology stocks frequently react to quarterly earnings, revenue growth, profit margins, forecasts, product announcements, regulatory developments, acquisitions, and leadership changes. Semiconductor companies may also respond to semiconductor ETFs, manufacturing capacity, export restrictions, and spending on artificial intelligence infrastructure.
Investors using Nasdaq Fintechzoom should therefore compare chart movements with the publication time of relevant news. A headline published after a large price move may explain what happened, but it does not necessarily predict what will happen next.
Technical Indicators That Add Context
Moving averages help show whether a stock is trading above or below its recent trend. The relative strength index, commonly called RSI, measures momentum and can indicate when buying or selling has become unusually intense. MACD compares moving averages to help identify possible changes in momentum.
These indicators are not guarantees. An RSI reading described as overbought does not mean a stock must immediately decline, and a bullish MACD crossover does not ensure further gains. Indicators become more useful when considered alongside volume, earnings, market conditions, and the investor’s time horizon.
What Moves Nasdaq Technology Stocks?
Interest rates are among the most important external influences. Many technology companies are valued partly on expectations of future earnings. When borrowing costs or bond yields rise, the present value investors assign to those future profits may decline.
Inflation data, employment reports, central-bank decisions, economic growth, government regulation, corporate debt, and geopolitical developments can also affect the sector. Artificial intelligence spending has become another significant driver, particularly for chipmakers, cloud providers, data-center operators, and enterprise-software companies.
Company fundamentals still matter. Revenue, free cash flow, debt, competitive position, valuation, customer growth, and management guidance provide a more complete picture than a live chart alone.
Common Mistakes to Avoid
One frequent mistake is confusing an index value with the price of an investable security. Investors cannot purchase an index directly, although funds may attempt to track its performance. Another mistake is assuming that every Nasdaq-listed company is a technology stock.
Investors should also avoid acting on one headline, indicator, or after-hours movement. Market information supports research, but it cannot account for an individual’s financial position, risk tolerance, or goals. Comparing information with primary company filings and established market sources can reduce the risk of relying on incomplete or outdated claims.
Frequently Asked Questions
1. Is Nasdaq Fintechzoom connected to the Nasdaq exchange?
No. Nasdaq Fintechzoom generally refers to FintechZoom’s independent coverage of Nasdaq indexes and listed companies. It should not be interpreted as an official Nasdaq product, brokerage account, or direct trading service.
2. What is the difference between the Nasdaq Composite and Nasdaq-100?
The Nasdaq Composite broadly covers common stocks listed on the Nasdaq exchange. The Nasdaq-100 tracks 100 of the largest eligible nonfinancial Nasdaq-listed companies and has substantial exposure to major technology and growth businesses.
3. Can I trade directly through FintechZoom?
FintechZoom primarily provides financial information, market coverage, and analysis. Investors normally execute trades through a regulated brokerage after completing their own research and reviewing the risks.
4. Which indicators help track technology stocks?
Price change, trading volume, market breadth, moving averages, RSI, MACD, earnings growth, company guidance, and bond yields can provide useful context. No indicator should be treated as a standalone trading signal.
Final Perspective
I see real-time tracking as a way to ask better questions, not as permission to make faster decisions. Charts can reveal momentum, volume can measure participation, and news can explain sudden changes, but company fundamentals determine whether a business deserves deeper attention.
By checking timestamps, comparing indexes, monitoring breadth, and verifying major claims, investors can turn a busy stream of technology-stock information into a more disciplined research process.